stats220
MEME…
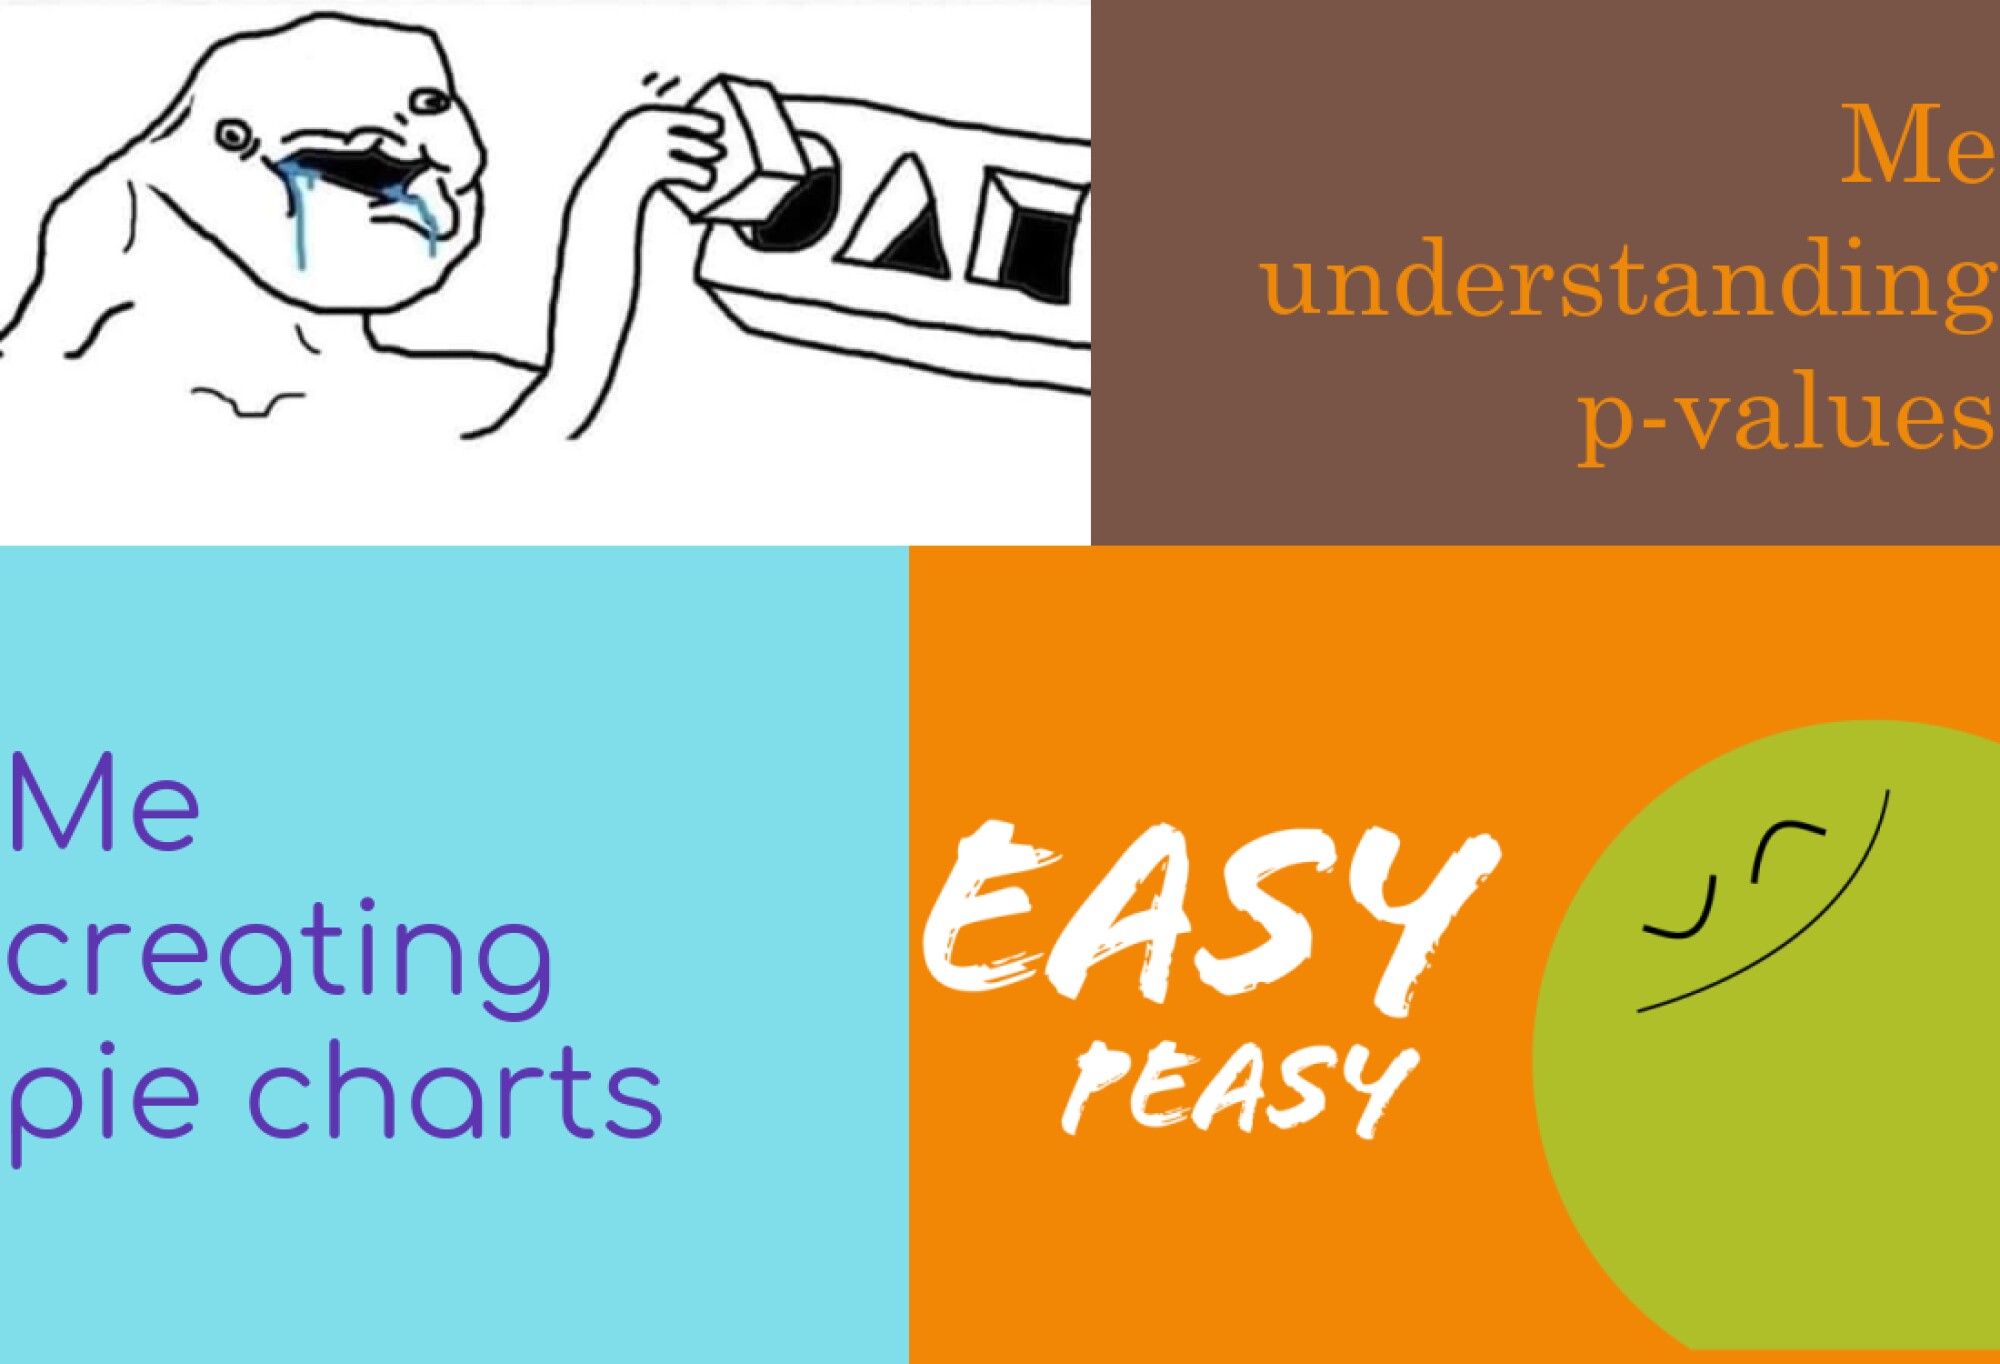
Below is a meme I made with the R package magick.
Motivation
The meme reflects my feelings toward certain aspects of stats where I find:
- Analysing p-values = a nightmare
- Creating pie charts = a piece of cake
The meme is new such that:
It is a variation of the old-school meme format (pic on the left & text on the right) in terms of:
- font
- text/pic arrangement
- “the message” comes from me
R code for my meme creation:
library(magick)

#square one
confused_face <- image_read("https://www.meme-arsenal.com/memes/f7300ccad0575bc19d9c8ee76acd5e82.jpg") %>%
  image_scale(600)

#square two
confused_text <- image_blank(width = 500,
                          height = 300,
                          color = "#795548") %>%
  image_annotate(text = "Me\nunderstanding\np-values",
                 color = "#ED8808",
                 size = 60,
                 font = "Century Schoolbook",
                 gravity = "east")

#square three
easy_text <- image_blank(width = 500,
                         height = 450,
                         color = "#80DEEA") %>%
  image_annotate(text = "Me\ncreating\npie charts",
                 color = "#5E35B1",
                 size = 70,
                 font = "Comfortaa",
                 gravity = "west")

#square four
easy_face <- image_read("https://cdn.dribbble.com/users/5310050/screenshots/12667763/media/6fe82de7f8a16fbe3e3e7032f272307b.png") %>%
  image_scale(600)


row_one <- image_append(c(confused_face, confused_text))

row_two <- image_append(c(easy_text, easy_face))


the_meme <- c(row_one, row_two) %>%
  image_append(stack = TRUE) %>%
  image_scale(2000)


image_write(the_meme, "my_meme.png")